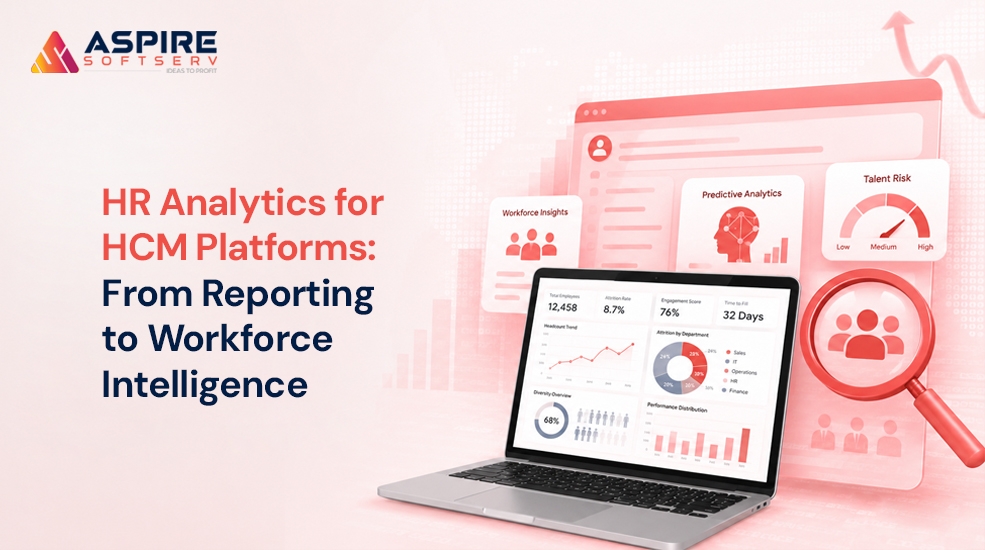
HR Analytics Is Broken And the Problem Starts at the Architecture Layer
HR analytics is broken not because organizations lack data, but because most HCM platforms were built for record-keeping, not intelligence. HR teams today sit on engagement scores, performance reviews, attrition history, compensation records, and recruitment data. Yet most HR leaders still cannot answer a question as basic as: "Which employees are most likely to leave in the next 90 days, and why?"
This is not a data problem. It is a product architecture problem.
Many HCM platforms were designed to store and retrieve employee information not to run predictive models, surface workforce insights in real time, or connect disparate signals into a single decision layer. When analytics tools are added on top of these architectures, the result is dashboards that describe what already happened rather than guiding what should happen next.
At Aspire Softserv, we have seen this pattern repeatedly across HCM platform engagements. The organizations that break through it are not the ones with the most data they are the ones that made the right architecture decisions early. For product engineering leaders and CTOs building or scaling HCM products, this gap represents both a measurable risk and a significant opportunity.
Why HR Analytics Fails: The Root Causes
Before any solution can be designed, it is important to understand why HR analytics breaks down in most organizations. The failure almost never begins with the analytics tool it begins in how the product was architected.
The most common failure is treating analytics as a reporting layer rather than a core product capability. Teams integrate a BI tool, connect it to their HRIS, build a few dashboards, and declare success. Within months, those dashboards go unused because they answer questions no one is actively asking and create no urgency to act.
The second major failure is data fragmentation. Employee data lives across an ATS, HRIS, payroll system, learning platform, engagement survey tool, and often a spreadsheet someone in HR operations maintains manually. Without a unified data foundation, every analysis requires manual extraction and reconciliation which means insights arrive weeks after the moment they were relevant.
The third failure is the absence of predictive capability. Most platforms stop at descriptive reporting: turnover rate was 14% last quarter. What HR leaders actually need is forward-looking intelligence: 47 employees in your highest-revenue business unit have elevated flight risk this month based on their engagement trend, tenure, manager relationship, and compensation gap. That requires predictive HR analytics, not a pie chart.
Common reasons HR analytics fails at the product level:
Data siloed across five or more disconnected systems with no unified employee identifier
Analytics interfaces designed for data scientists, not HR generalists
No feedback loop between insights generated and interventions taken
Poor data quality that erodes trust in outputs over time
Platforms built without the AI/ML infrastructure to move beyond historical reporting
The Hidden Cost of Staying at the Reporting Level
When HCM platforms remain at the reporting level, the consequences extend well beyond HR inefficiency they affect product differentiation, enterprise sales cycles, and customer retention directly.
| Platform Limitation | Business Impact |
|---|---|
| No employee attrition prediction capability | Higher customer churn as HR teams seek smarter workforce analytics tools |
| No workforce planning analytics | Lower product differentiation during enterprise software evaluations |
| No AI-ready data architecture | Slower product roadmap execution when AI capabilities become a strategic priority |
| Fragmented employee data | Enterprise deals become harder to win and close due to incomplete workforce visibility |
| Reporting-only dashboards | Lower customer stickiness and increased renewal risk |
| No intervention workflow design | Predictions may exist, but user behavior and business outcomes do not improve |
The competitive risk is not that your platform lacks dashboards most platforms have dashboards. The risk is that competitors are building workforce intelligence while you are still delivering reports. In enterprise sales cycles, that gap shows up as a lost deal. In renewals, it shows up as churn.
The Four-Layer Architecture That Powers Workforce Intelligence
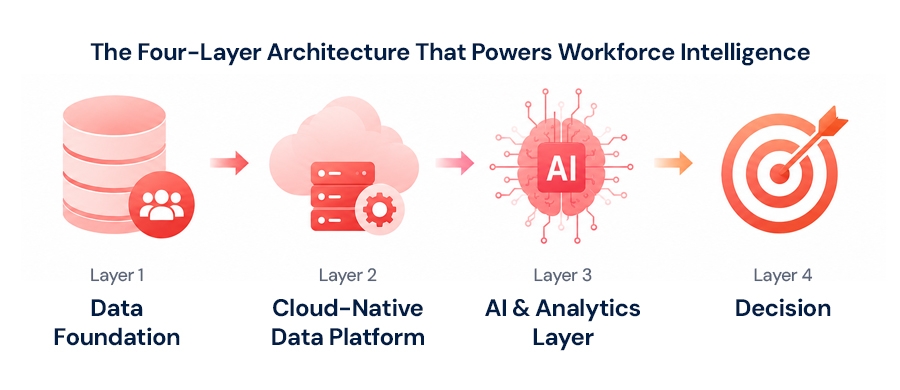
Most HCM products today have Layer 1 and partial Layer 4. The competitive gap and the product opportunity lies in Layers 2 and 3. Understanding what each layer requires from an engineering perspective is where Product Strategy & Consulting work typically begins.
Layer 1 Data Foundation is about data completeness and governance. If an employee's compensation history exists in payroll but not in the analytics layer, attrition models will produce unreliable signals. Building Layer 1 correctly requires software product development discipline: defining a canonical employee data model, establishing unique identifiers across systems, and automating ingestion through well-governed ETL pipelines with validation built in at the source.
Layer 2 Cloud-Native Data Platform is the infrastructure layer. A cloud-native platform built on AWS, Azure, or Google Cloud enables the scale, flexibility, and processing speed that AI-powered HR analytics demands. This is where Cloud and DevOps Engineering becomes critical. A lakehouse architecture allows both structured HR data and unstructured signals survey responses, performance review text, collaboration patterns to be processed together at scale.
Layer 3 AI & Analytics Layer is where intelligence is created. Machine learning models trained on historical employee data can predict attrition risk, identify high-potential employees, forecast hiring needs, and score candidates against role-specific performance profiles. This is the layer most HCM platforms are missing, and the one that creates defensible product differentiation in competitive evaluations.
Layer 4 Decision Layer brings intelligence into the workflow, and this is where product design and prototyping matters most. A prediction that lives inside a data warehouse changes nothing. An alert that reaches a manager at the moment an employee crosses a risk threshold with a recommended conversation guide and a flag for the HR business partner drives behavior change. The interface must surface the right insight to the right person at the right moment, in a format they will actually act on.
Employee Attrition Prediction: The Highest-Value Use Case
Among all HR analytics applications, employee attrition prediction using AI delivers the fastest and most measurable ROI. Voluntary turnover is expensive, quantifiable, and when the right architecture is in place preventable if you see it coming early enough.
Attrition prediction models analyze patterns across multiple data dimensions simultaneously. Engagement survey trends, time since last promotion, compensation relative to market benchmarks, manager team performance history, and overtime hours all contribute meaningful signal. When combined in a well-trained model, these variables can identify employees likely to leave three to six months before a resignation is submitted.
The critical design insight is that the model alone is not the product. The intervention workflow is the product. A risk score sitting in a database changes nothing. When that score triggers a manager notification with a recommended action and flags the HR business partner for follow-up, behavior changes and attrition decreases.
Key predictors in a well-designed attrition model:
| Predictor Category | Signal Variables | Indicative Weight Range* |
|---|---|---|
| Engagement | Survey scores, eNPS trends, participation rate | 30–35% |
| Career Progression | Time since promotion, internal mobility history | 20–25% |
| Manager Quality | Team engagement delta, manager-level turnover rate | 15–20% |
| Compensation | Pay equity ratio, market benchmark gap | 15–20% |
| Work-Life Balance | Overtime hours, PTO utilization patterns | 10–15% |
Weight ranges are indicative based on commonly referenced ML model architectures (Deloitte Human Capital Trends, SHRM workforce research). Actual weights vary significantly by organization and must be derived from training on your specific workforce data.
Research from McKinsey and Deloitte consistently points to voluntary turnover costing organizations 50–200% of an affected employee's annual salary when recruiting, onboarding, and productivity loss are included. For an enterprise HCM customer managing 5,000 employees, even a modest reduction in attrition translates to significant cost avoidance a figure Aspire HCM clients have seen reflected in their own workforce data after deploying prediction-driven intervention workflows.
Platforms of this kind also require rigorous automated validation, model testing, and regression testing across data updates. This is where QA Engineering becomes non-negotiable not just for software reliability, but for model integrity. A poorly validated attrition model that generates false positives erodes trust faster than having no model at all.
Workforce Planning Analytics: From Headcount to Strategic Forecasting
Workforce planning analytics is the second highest-impact use case for HCM platforms and the one most directly connected to business outcomes beyond the HR function itself.
Basic workforce planning is reactive: a business unit requests 20 engineers, HR begins recruiting. Advanced workforce planning analytics is predictive: the platform analyzes growth trajectory, skill inventory, internal mobility patterns, and historical time-to-fill data to forecast that the business unit will need 20 engineers in Q3 and that six of those needs could potentially be met through internal upskilling if development
What advanced workforce planning analytics enables:
programs begin now.
This capability requires the full four-layer architecture described above. It also requires close integration between the HR analytics layer and business planning data, which is why Product Strategy & Consulting is often the right starting point. Before building, product leaders need to define which business decisions the platform will support and work backward to the data and model requirements.
Predicting hiring needs 6–12 months ahead of actual demand
Identifying critical skill gaps before they affect delivery timelines or product roadmaps
Optimizing the balance between internal mobility and external hiring to reduce cost-per-hire
Enabling HR to present to the CFO with data-backed headcount plans rather than estimates
According to SHRM research, organizations using data-driven workforce planning report improvements in time-to-fill and reductions in cost-per-hire compared to those relying on manual forecasting outcomes that HCM platforms can reference directly when positioning to enterprise buyers.
HR Dashboard Metrics That Drive Decisions, Not Just Reports
The HR metrics dashboard is often the first thing HCM platforms build and the last thing that gets meaningfully redesigned. Most dashboards report what happened. The most effective ones change what happens next.
The distinction is between descriptive metrics and actionable intelligence. A voluntary turnover rate of 14% is informative. A dashboard showing that 23 employees in your highest-revenue business unit are flagged as high flight risk this month with recommended interventions attached creates urgency and drives action.
Descriptive metrics vs. actionable intelligence:
| Category | Descriptive Metric | Actionable Intelligence |
|---|---|---|
| Attrition | Voluntary turnover rate (monthly) | Attrition risk score distribution by team |
| Retention | Exit interview themes | Intervention success rate by risk segment |
| Performance | Performance rating distribution | Top performer retention rate by manager |
| Hiring | Time-to-fill in days | Quality of hire at 12 months by source channel |
| Engagement | eNPS score (bi-annual) | Engagement trend by cohort and manager |
| Workforce | Total headcount | Critical skill gap coverage percentage |
Designing for actionability rather than comprehensiveness is a product design and prototyping discipline. The best workforce intelligence dashboards are built around specific decisions that specific roles need to make, not around every metric the data layer can produce.
Signs Your HCM Platform Has Outgrown Basic Reporting
Many HCM product teams do not realize their architecture is limiting them until customers start asking for capabilities the platform cannot deliver. By the time this surfaces in a sales conversation or a renewal discussion, the gap is already costing deals.
Common signals that your platform has outgrown its current architecture:
Customers requesting predictive HR analytics features that require data your platform does not currently unify or collect
Dashboard load times degrading as data volumes grow across your customer base
Analytics outputs that HR teams distrust because data quality issues are visible in the numbers
Competitors launching AI-powered features while your roadmap remains focused on reporting improvements
Enterprise customers asking about AI and ML capabilities during evaluation cycles and not getting a satisfying answer
Renewal conversations shifting toward platform limitations rather than value delivered
If any of these resonate, the issue is almost always architectural. The right response is a structured assessment of the current data layer, infrastructure, and AI readiness before committing further resources to a roadmap the architecture cannot support.
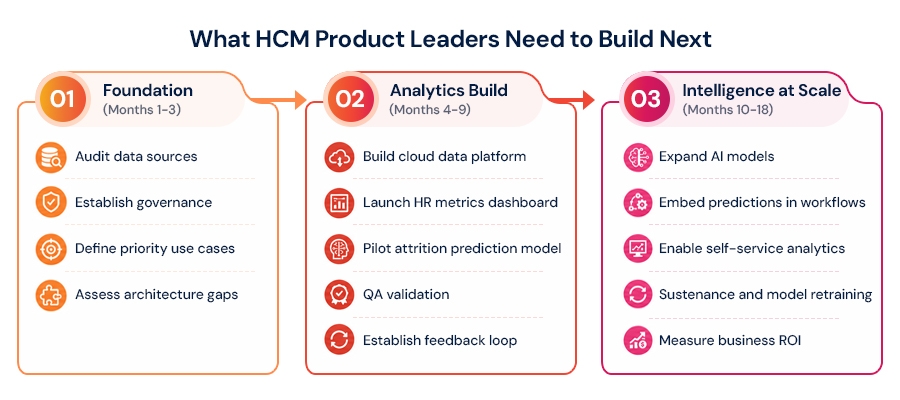
What HCM Product Leaders Need to Build Next
If you are a CTO, product owner, or founder at an HCM platform, the question is not whether to build AI-powered workforce analytics it is how to sequence the build correctly and which engineering capabilities to prioritize at each stage.
The most common mistake is starting with Layer 4 dashboards and interfaces before establishing Layer 2, the cloud data infrastructure. This produces visually impressive outputs with unreliable data underneath, which erodes user trust faster than having no dashboard at all.
The recommended build sequence:
Audit current data sources and identify gaps in the unified employee record
Establish a cloud-native data platform with automated pipelines through Cloud and DevOps Engineering
Define the first predictive use case typically employee attrition prediction using AI and build a focused model with proper QA validation
Design the intervention workflow through product design and prototyping what happens when the model flags a high-risk employee?
Measure intervention effectiveness and retrain models on real-world outcomes
Expand to additional use cases: recruitment scoring, workforce forecasting, skills gap analysis
It is also important to recognize that workforce intelligence systems are not one-time builds. Models require retraining as workforce patterns shift. Integrations evolve as customers upgrade their HRIS or add new tools. Data sources change. This is where Product Sustenance & Support becomes a critical part of the long-term platform strategy ensuring the platform continues delivering reliable, accurate insights rather than degrading quietly as the environment around it changes.
The Product Engineering Perspective
HR analytics done right is a product engineering problem as much as it is a data problem. The architecture decisions made early how data is ingested, how models are deployed, how insights surface to end users determine what the platform can do five years from now, not just at the next release.
Aspire Softserv has helped HCM platforms serving enterprise customers build this architecture from the ground up and retrofit it into existing products where the data foundation was sound but the intelligence layer was missing. The pattern we see consistently is that platforms which invest in the architecture early compound their advantage with every dataset they collect and every model they refine.
Product Strategy & Consulting helps HCM product teams define the right use cases and architecture direction before resources are committed. Product design and prototyping validates that analytics interfaces will be used by HR generalists, not just data analysts. Software product development builds the scalable, maintainable systems underneath. Cloud and DevOps Engineering ensures the infrastructure handles growing data volumes and model complexity without becoming a maintenance burden. QA Engineering validates model outputs and prevents data quality failures from reaching users. And Product Sustenance & Support keeps the intelligence layer reliable as the platform and its integrations evolve.
The HCM platforms winning in 2025 and beyond treat workforce intelligence as a core product competency not a feature to be bolted on after the fact.